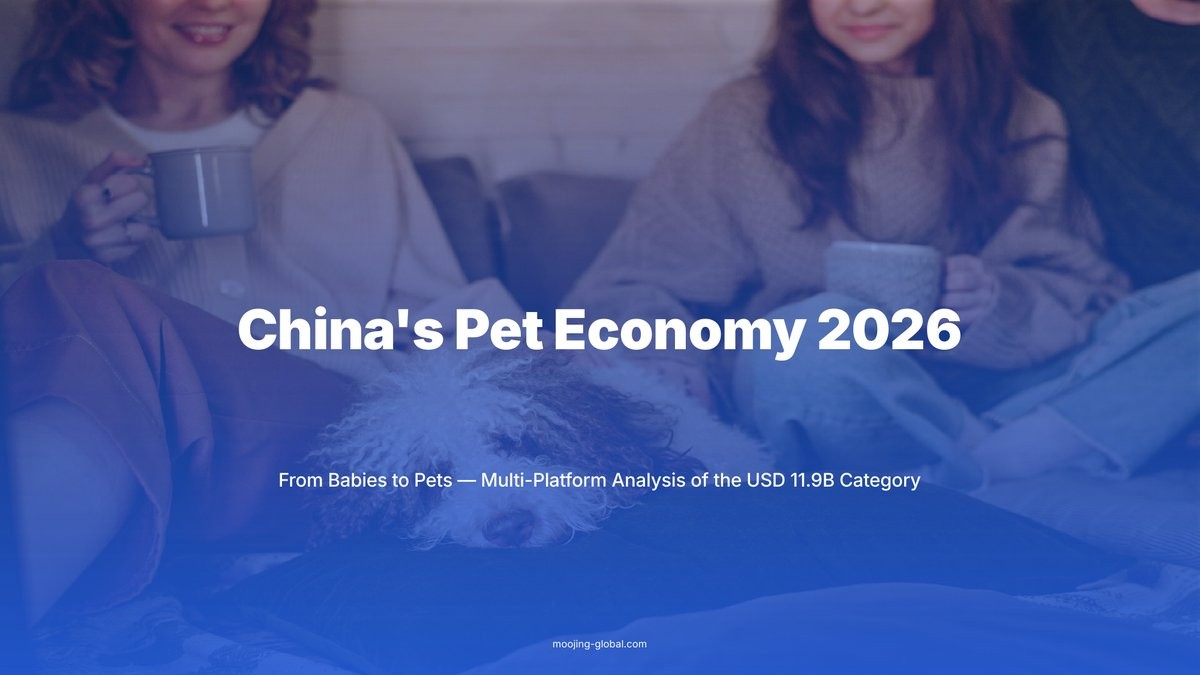
China vs the US: A Decade of Per-Pet Spend Runway
 By Quan Wenjun
7 min read
By Quan Wenjun
7 min read
Executive Summary#
Get the Full Report: Download the complete analysis for detailed data, methodology, and pages of insights.
China's pet category at USD 11.9 billion in 2025 is roughly 8.5% the size of the United States' USD 139.3 billion category, and on a per-pet basis the gap is sharper still: USD 95 against the US at USD 961 — a ten-fold spread that defines the structural runway of China pet for the next decade-plus. Both markets are expanding at comparable percentage rates (China +17.5% YoY, US +19.7%) on vastly different bases. China per-pet spend moved from USD 83 in 2024 to USD 95 in 2025, a +14.5% YoY step-up that places the market on a closing trajectory toward the Hong Kong benchmark of USD 122 within a five-to-seven-year window. Domestic Chinese brands now hold the majority of leading shelf positions, and PETKIT — the canonical Chinese pet export brand — is consistently visible across Singapore, Malaysia, and Thailand. For investors and global pet brands, the per-pet spend gap is the single cleanest definition of the China opportunity.
The Per-Pet Spend Gap: USD 95 vs USD 961#
The cleanest single read on the China pet opportunity is per-pet annual spend. China at USD 95 sits roughly one-tenth of the US at USD 961, and that ratio is the structural runway for the next decade.
The gap is not a measure of category weakness; it is a measure of category headroom. China's USD 11.9 billion pet e-commerce category grew +17.5% YoY in 2025 on a base large enough to sustain serious capital deployment and small enough for the next decade of premiumisation to compound meaningfully against the per-pet ceiling already mapped by mature peers. Per-pet spend itself moved from USD 83 in 2024 to USD 95 in 2025 — a +14.5% YoY expansion indicating that premiumisation is contributing more to growth than pet-population expansion alone.
Even with no incremental pet-population growth, premiumisation alone could roughly triple per-pet spend toward the Hong Kong benchmark over a five-to-seven-year window. US-level per-pet spend remains the asymptotic ceiling.
Cross-Market Benchmarks: China, US, Hong Kong, Japan#
The per-pet spend chart compares four reference markets and reveals a clean hierarchy.
China per-pet spend trails the US by an order of magnitude

Why the 10× Gap Implies a Decade-Plus Runway#
The macro context behind the China-US gap is multi-causal, and each contributing factor is closing.
Lower per-pet healthcare and prescription spend is the largest single contributor: China pet healthcare at USD 0.58 billion in 2025 represents roughly 4.9% of the category — a fraction of the equivalent US share — and is the fastest-growing sub-segment by ASP. Less developed pet-services adjacency is the second factor: services captured USD 0.02 billion in trackable e-commerce GMV against a multi-billion-dollar US services market. Owner cohort maturity is the third: China's pet-owner population skews younger, and as the post-2018 entry cohort moves into their fifth and sixth year of pet ownership, basket profiles expand toward specialty diets, supplements, prescription items, and aesthetics.
The +14.5% YoY per-pet step-up from 2024 to 2025 is the leading-edge proof point that each gap is closing.
Domestic Brand Strength: Mid-Tier Leadership in China#
Domestic Chinese brands hold seven of the top ten positions by 2025 multi-platform combined revenue, with foreign brands occupying three premium pet-food slots. The structural mix matters for how the per-pet runway will be captured.
Domestic players lead the entry tier (under CN¥ 50) at 12.5% combined top-five share against 0.1% foreign, and dominate the mid-tier (CN¥ 50-150) at 35.6% against 11.6% foreign. Foreign brands retain leadership in the premium tier (CN¥ 150-400) at 23.2% versus 10.9% domestic, and in the super-premium tier (CN¥ 400+) at 11.8% versus 3.2%. Domestic premium-tier share moved from sub-1% in 2020-2021 to 10.9% in 2025 — a five-year advance that mirrors what domestic brands achieved in beauty and dairy through their respective premiumisation cycles.
The next contested boundary is the CN¥ 150-400 premium tier.
PETKIT and the Hardware-Led Export Model into SEA#
Southeast Asia is the second-largest external benchmark for the China pet category and the most relevant near-term export geography for Chinese pet brands.
Singapore at USD 730 million is the largest SEA pet e-commerce market in 2025 across the principal cross-border marketplace and content-commerce platforms, followed by Malaysia at USD 350 million and Thailand at USD 118 million. Year-on-year growth across the three markets ranges from approximately +50% to +70% on a 2024 base — materially faster than the China home-market growth rate of +17.5%, on bases roughly one-twentieth to one-hundredth the size. Indonesia, Vietnam, and the Philippines lack standalone pet category coverage in this dataset and remain green-field for future expansion.
PETKIT (智能宠物) has emerged as the canonical Chinese export brand, holding top-three brand visibility on the principal Malaysia cross-border marketplace and consistently flagged as a leading Chinese-origin pet brand across all three SEA tier-1 markets. The pattern confirms a working export model: hardware-led product differentiation rather than price competition. PETKIT's playbook — Singapore as premium beachhead, Malaysia as volume-conversion play, Thailand as high-growth small-base entry — is the most directly relevant template available for Chinese pet food and supplies brands considering SEA entry.
Implications for Strategic Investors#
For investors and global pet brands, the per-pet spend gap implies a specific capital-allocation posture.
Pet sub-segments deserve growth multiples, not staples multiples. Healthcare and accessories are converging with mature peer markets over a five-to-seven-year horizon.
China premium-tier entry should be timed against the 2026-2028 share-shift window. Foreign super-premium positioning remains defensible, but premium-tier share is being actively contested.
SEA export economics now justify dedicated capital. PETKIT's visibility across SG, MY, and TH confirms early footholds, and +50% to +70% YoY growth rates indicate the cross-border platform infrastructure is working.
The per-pet runway makes the FMCG corporate pivot capital-rational. Chinese FMCG parents are reallocating capital into pet subsidiaries because the spend gap is the spending headroom that justifies the pivot.
Key Takeaways#
- China per-pet spend at USD 95 is roughly one-tenth of the US at USD 961 — the structural runway for the next decade-plus of category premiumisation.
- China per-pet spend grew +14.5% YoY in 2024-2025 (USD 83 to USD 95), with premiumisation leading pet-population expansion.
- Hong Kong at USD 122 per-pet is the realistic five-to-seven-year benchmark; the US is the asymptotic decade-plus ceiling.
- Domestic brands hold seven of the top ten leading positions and have advanced premium-tier share from sub-1% to 10.9% over five years.
- PETKIT is the canonical Chinese pet export brand, with top-tier visibility across Singapore, Malaysia, and Thailand under a hardware-led, differentiation-driven model.
- SEA pet category 2025: Singapore USD 730M, Malaysia USD 350M, Thailand USD 118M, growing at +50% to +70% YoY.
About the Data#
This analysis draws on Moojing Market Intelligence (魔镜洞察) multi-platform e-commerce research across the principal China pet platforms and the principal Southeast Asian cross-border platforms. Hong Kong figures reference HKTVmall full-year 2025 data (~700,000 dogs and cats). The Japan figure reflects an Amazon JP coverage subset; the full Japan pet e-commerce market is estimated at USD 1.6 to 2.3 billion. China per-pet spend is calculated against the China multi-platform pet e-commerce category at USD 11.9 billion in 2025. Indonesia, Vietnam, and the Philippines lack standalone pet category coverage in the SEA dataset and are excluded from country-level rankings.
More from This Report
This article is part of our report series:
Download the Full Report
Get the complete analysis with detailed data, methodology, and additional insights.
This content adheres to Moojing's editorial standards .