The Hairdryer Price Ladder: Where Listings Crowd and Where Revenue Sits
 By Jessie Wang
5 min read
By Jessie Wang
5 min read
Executive Summary#
Get the Full Report: Download the complete analysis for detailed data, methodology, and pages of insights.
Assortment crowds the bottom of the hairdryer price ladder; revenue does not. Entry products under $50 (CN¥ 360) are 62.0% of listings on a leading US marketplace but 39.1% of revenue, while the flagship tier at $249 and above (CN¥ 1,804) is 3.1% of listings and 15.8% of revenue — roughly 8× the per-product productivity of the entry tier. A leading UK marketplace repeats the shape: 70.6% of assortment for 43.0% of revenue at entry, 10.8% of revenue from 2.4% of listings at flagship. Product counts and revenue therefore point a brand at different parts of the market. The open corridor for an entrant is $35–$120 (CN¥ 250–870), with $97–$193 (CN¥ 700–1,400) the most contested ground.
The US Ladder: Six Bands, Two Different Answers#
Across the two years to May 2026, the US category generated $889M (CN¥ 6.44B) at an average price of $49 (CN¥ 354) across 6,578 products. Split across six price bands, assortment and revenue separate immediately.
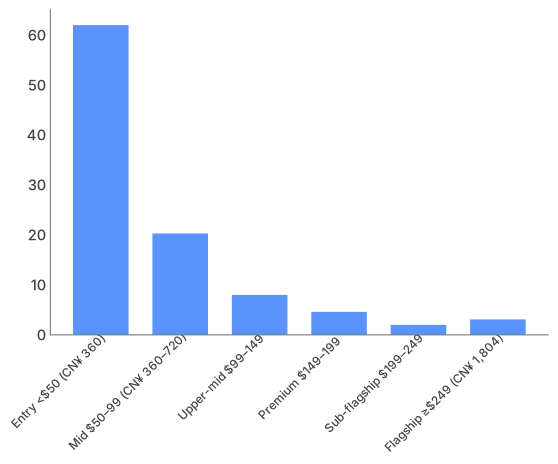
The entry band under $50 (CN¥ 360) holds 62.0% of products and returns 39.1% of revenue, $348M. The mid band at $50–99 (CN¥ 360–720) is where the measures line up — 20.3% of listings, 20.3% of revenue, $181M. Above it, each band earns more revenue share than listing share, as the chart shows: upper-mid adds $110M, premium $88M, sub-flagship $22M.
The flagship band at $249 and above (CN¥ 1,804) then inverts the assortment view: 3.1% of products produce 15.8% of revenue, $141M — more than the upper-mid or premium bands each contribute, from a fraction of the listings. That is the roughly 8× productivity gap, the clearest structural signal here.
US hairdryer bands — share of products against share of revenue
The UK Ladder Runs the Same Shape at a Lower Absolute Level#
The UK category produced $127M (CN¥ 920M) over the same two years at an average price of $43 (CN¥ 315) across 2,079 products. Its bands repeat the US pattern with a heavier entry assortment: 70.6% of products sit under $44 (CN¥ 322) for 43.0% of revenue ($55M), and the mid band at $44–89 (CN¥ 322–645), 18.0% of products and 20.4% of revenue ($26M).
The upper bands read differently: upper-mid at $89–134 (CN¥ 645–968), 3.6% of products and 6.5% of revenue ($8M); premium at $134–178 (CN¥ 968–1,291), 3.1% and 11.8% ($15M) — more revenue share than upper-mid, from fewer listings; sub-flagship at $178–223 (CN¥ 1,291–1,613), 2.3% and 7.5% ($10M); flagship at $223 and above (CN¥ 1,613), 2.4% and 10.8% ($14M).
The UK thus carries a thinner upper-band assortment than the US and still routes a comparable proportion of revenue there; assortment evidence alone reads only part of the ladder.
The Open Corridor and the Contested Middle#
Two ranges matter operationally. The open corridor at $35–$120 (CN¥ 250–870), spanning entry into upper-mid in both markets, is where the export-challenger cohort operates and grows fastest. The contested ground at $97–$193 (CN¥ 700–1,400) is where established archetypes and challengers meet.
With premium-technology products reaching around $412 (CN¥ 2,985), price-sensitive buyers move toward specification-comparable alternatives at $120–$160 (CN¥ 870–1,159) rather than leaving the premium proposition. That is the demand the corridor's top end catches, above the professional-salon archetype's typical price of around $91.
Practically: a launch inside the corridor competes on specification against products a buyer already cross-shops, while one aimed at the contested band needs a reason to be chosen before a price.
What These Figures Do and Do Not Support#
These band figures are period totals for June 2024 to May 2026 — two years of revenue summed, not a time series — with no year-on-year growth by price band. They show where revenue sits, not which bands grow fastest; growth statements here come from market-level and cohort-level figures, so band-level growth questions need separate analysis.
Key Takeaways#
- Benchmark against revenue share, not product counts. US entry products are 62.0% of listings for 39.1% of revenue; the flagship band 3.1% for 15.8%.
- Flagship economics stand out. At roughly 8× entry-tier per-product productivity, the US flagship band returns $141M of the $889M (CN¥ 6.44B) two-year total.
- The UK repeats the shape. 70.6% of UK listings sit at entry for 43.0% of revenue; 2.4% at flagship return 10.8%.
- Enter in the corridor. $35–$120 (CN¥ 250–870) is where the export cohort operates and grows fastest; $97–$193 (CN¥ 700–1,400) is the most contested ground.
- Watch the upper edge. With premium technology reaching around $412 (CN¥ 2,985), buyers are moving to specification-comparable products at $120–$160 (CN¥ 870–1,159).
- These are period totals. With no growth-by-band figures in the dataset, the ladder describes position, not momentum.
About the Data#
This analysis draws on Moojing Market Intelligence proprietary research covering a leading US marketplace and a leading UK marketplace, in the Hair Dryers & Accessories category as each classifies it. The window runs from June 2024 to May 2026 — 8,657 products on sale across the two markets — and market totals quoted here are two-year, not annual, figures. Monetary values are CN¥ -denominated in the source and shown converted to USD at CN¥ 1 = $0.138, with CN¥ in brackets. Price bands are period aggregates with no year-on-year growth breakdown. German market data access was restricted here and Japanese category volume was negligible, so these findings describe the US and UK, and other European markets need separate analysis.
Download the Full Report
Get the complete analysis: both market ladders, the archetype view of the field, the product and technology direction, the export-challenger strategies, and the methodology.
This content adheres to Moojing's editorial standards .