In 2017, fidget spinners were very popular. This article carries out a quantitative review of this phenomenon.
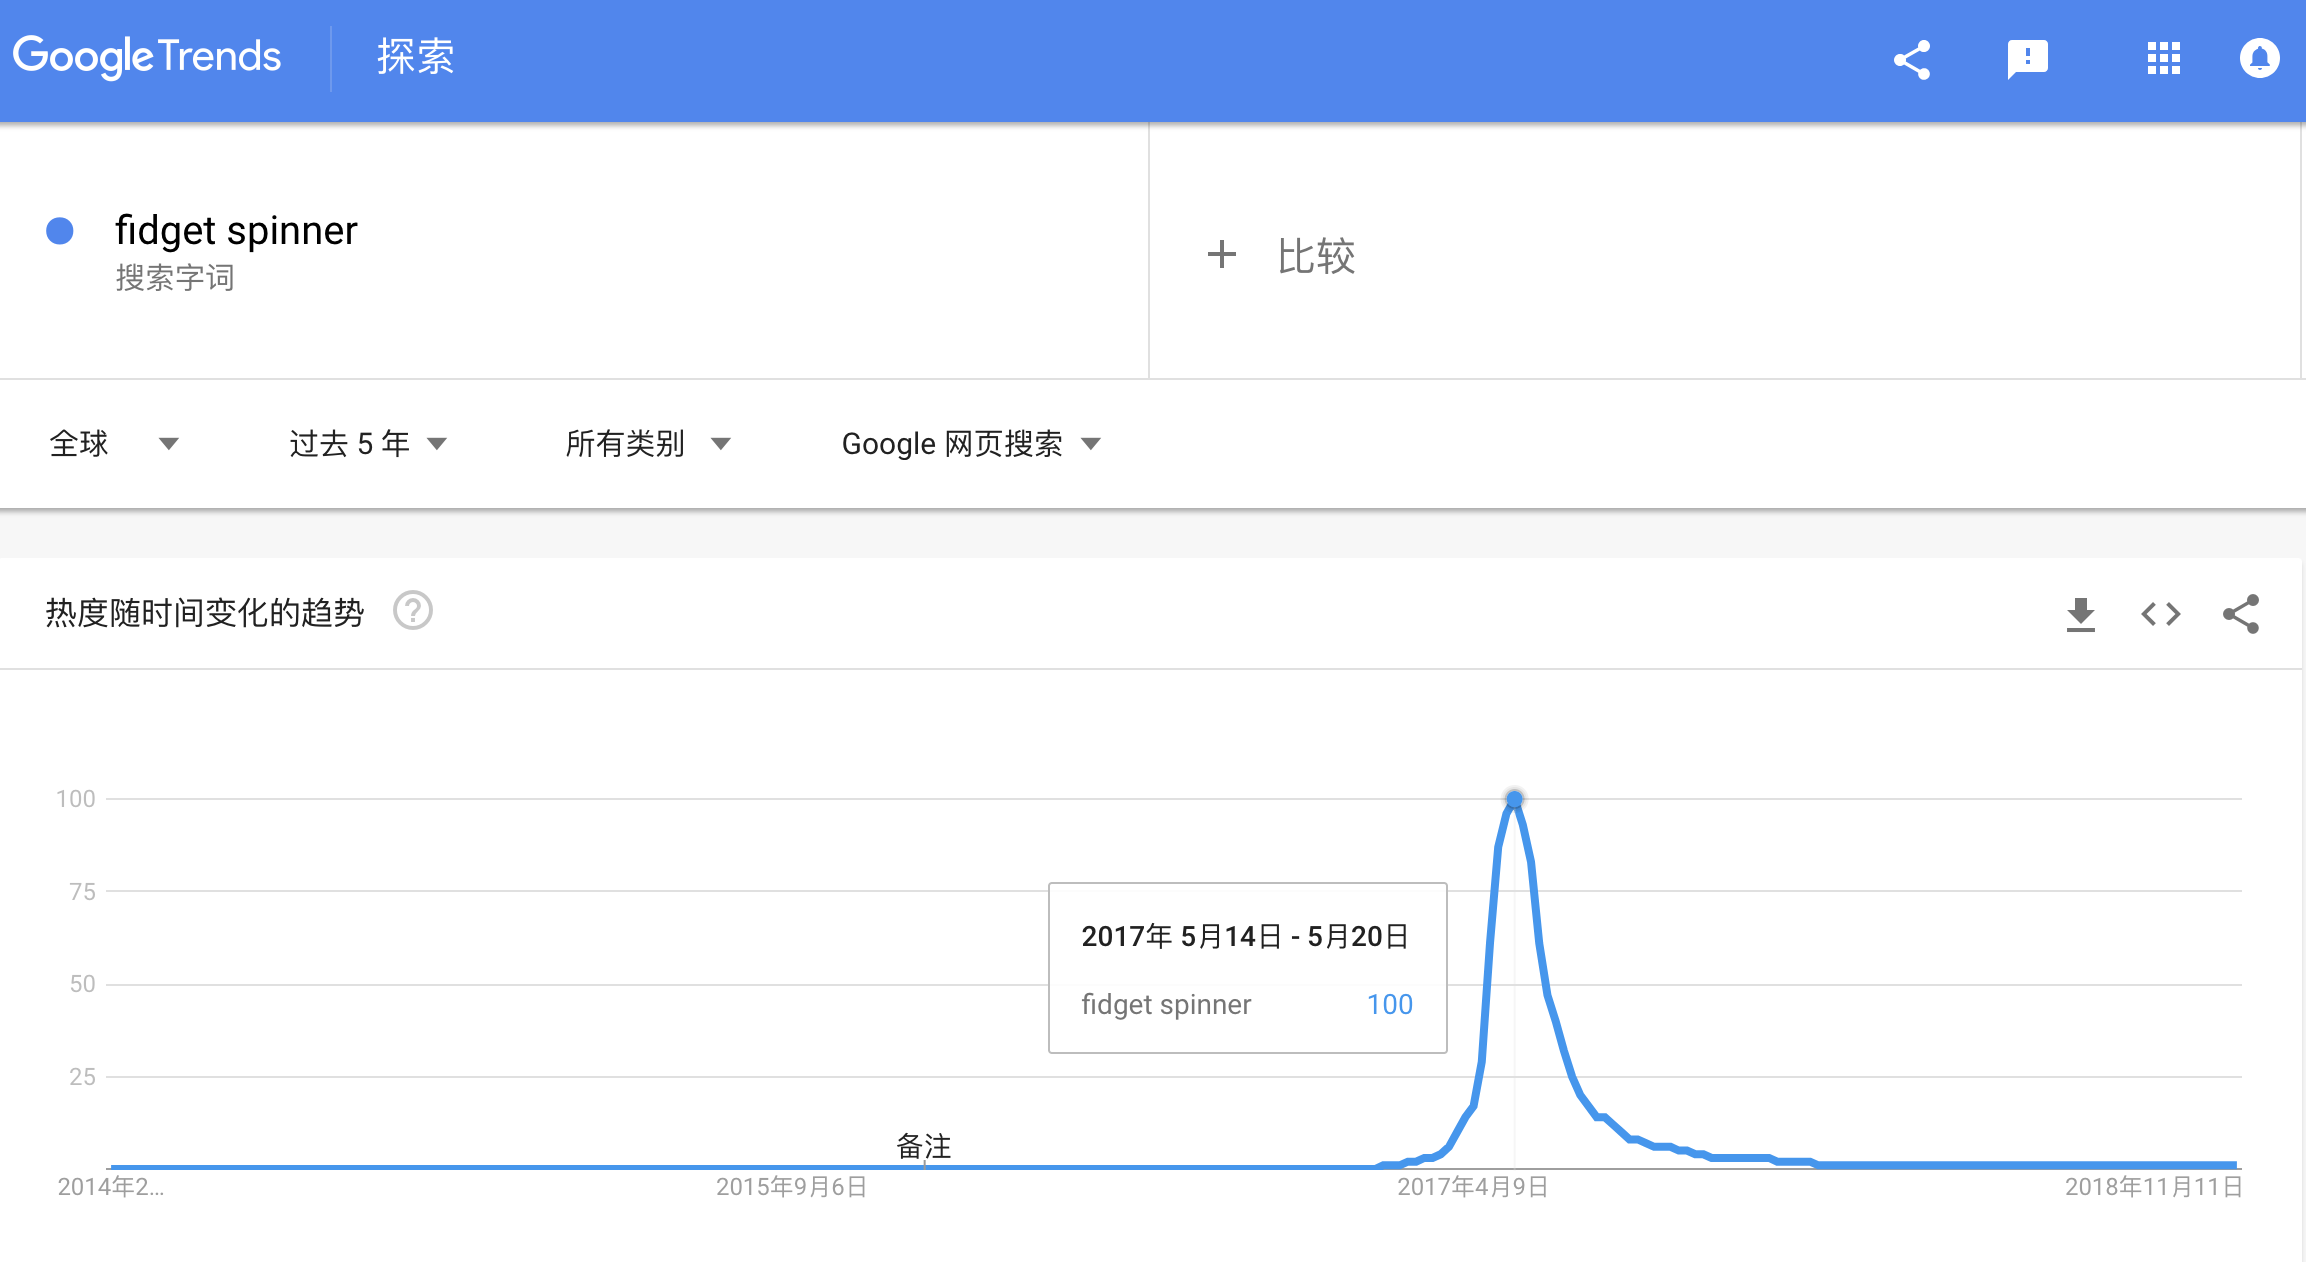
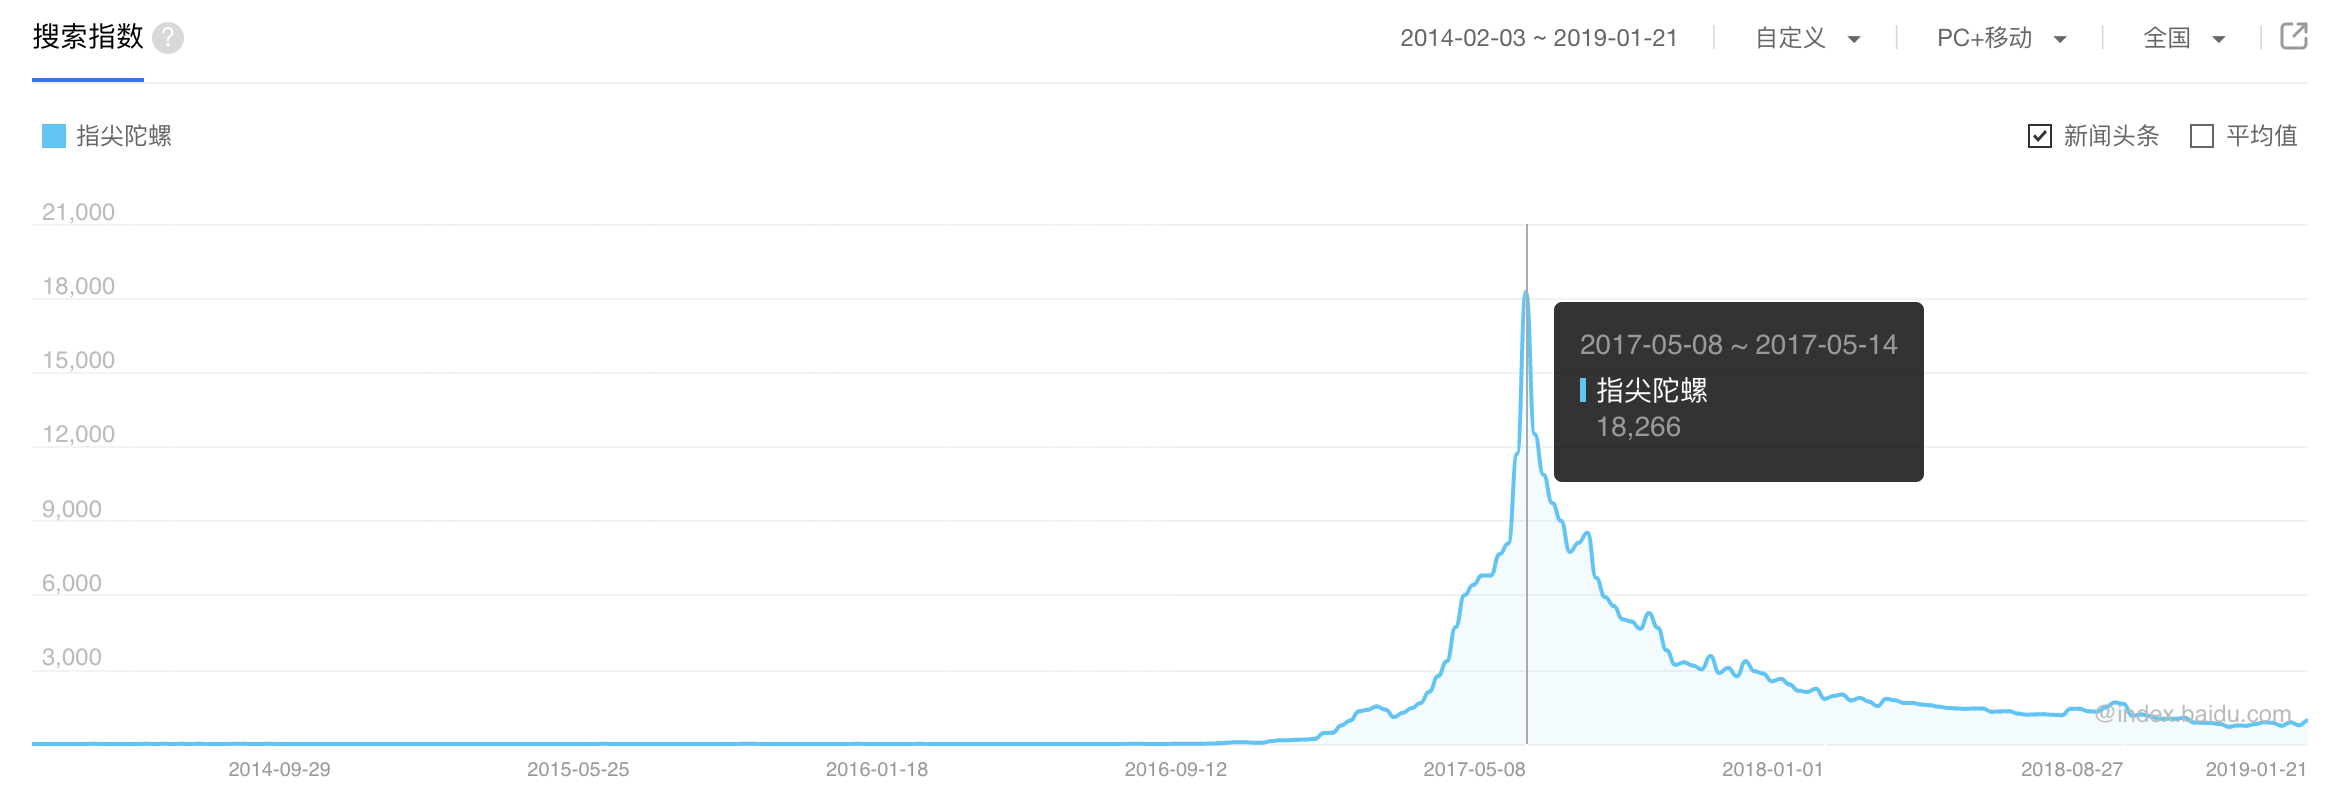
First, it is visible from Google Trends and Baidu Index that the craze started around late 2016 and reached its peak in May 2017.
According to Moojing Market Intelligence e-commerce data, on Tmall and Taobao platforms, the sales trend of fidget spinners from 2017 to 2018 is as follows: The momentum began in January 2017, peaked in May and June with the highest sales volume, then rapidly declined and entered a long tail of low profitability. Overall, even during the best-selling months of May and June 2017, the peak sales were only just over 40 million yuan, which is not considered a particularly huge hit compared to other categories on e-commerce platforms.
From the sales volume, a total of 12.36 million pieces were sold, accounting for less than 1% of the total population. That is to say, up until now, out of every 100 people, there is 1 who has bought a fingertip gyroscope, which can only be considered a niche proportion. Therefore, the editor's judgment is that the fingertip gyroscope is one of those products/toys that are hyped up by the media, but are not actually popular with the masses.
The number of brands selling fingertip gyros is numerous, skyrocketing from 25 brands in January 2017 to a peak of over 1000, with still 300-400 brands remaining by December 2018. A total of 2700 brands have appeared in these two years. This also indicates that, even after the peak, a substantial number of new brands continued to enter the market, which, in the editor's opinion, is not a wise, data-based business decision.
Which Brands Made a Profit? Let's take a look at the distribution of total sales by brand for the years 2017-2018 (only the top 20 are shown). The editor noticed that the brand with the highest sales is "other," which usually refers to unbranded goods or situations where the seller is too lazy to fill in the brand. It can be considered a collection of a large number of unbranded goods. Therefore, the actual number of brands for fidget spinner sales is much greater than 2,700. The brand ranked second only made 10 million in sales over two years. With such fierce competition, unless you entered the market very early with an excessively high-profit margin, you would barely make any money.
Looking at the historical average price, the lowest price is basically around 22 yuan. The editor believes that this point is the point where there is basically no profit. Around June 2017, the price was over 30, which should yield an excess profit of about 10 yuan. If we calculate based on 3 million pieces sold, the total profit should be around 30 million yuan.
The Sales Volume Brand Distribution During the Peak Selling Period From May to July 2017 Is As Follows (Top 20 Shown Only).
The editor gains the following insights from the above data: